Home > Training > Auditor > Dashboard
Workspace Overview: Dashboard
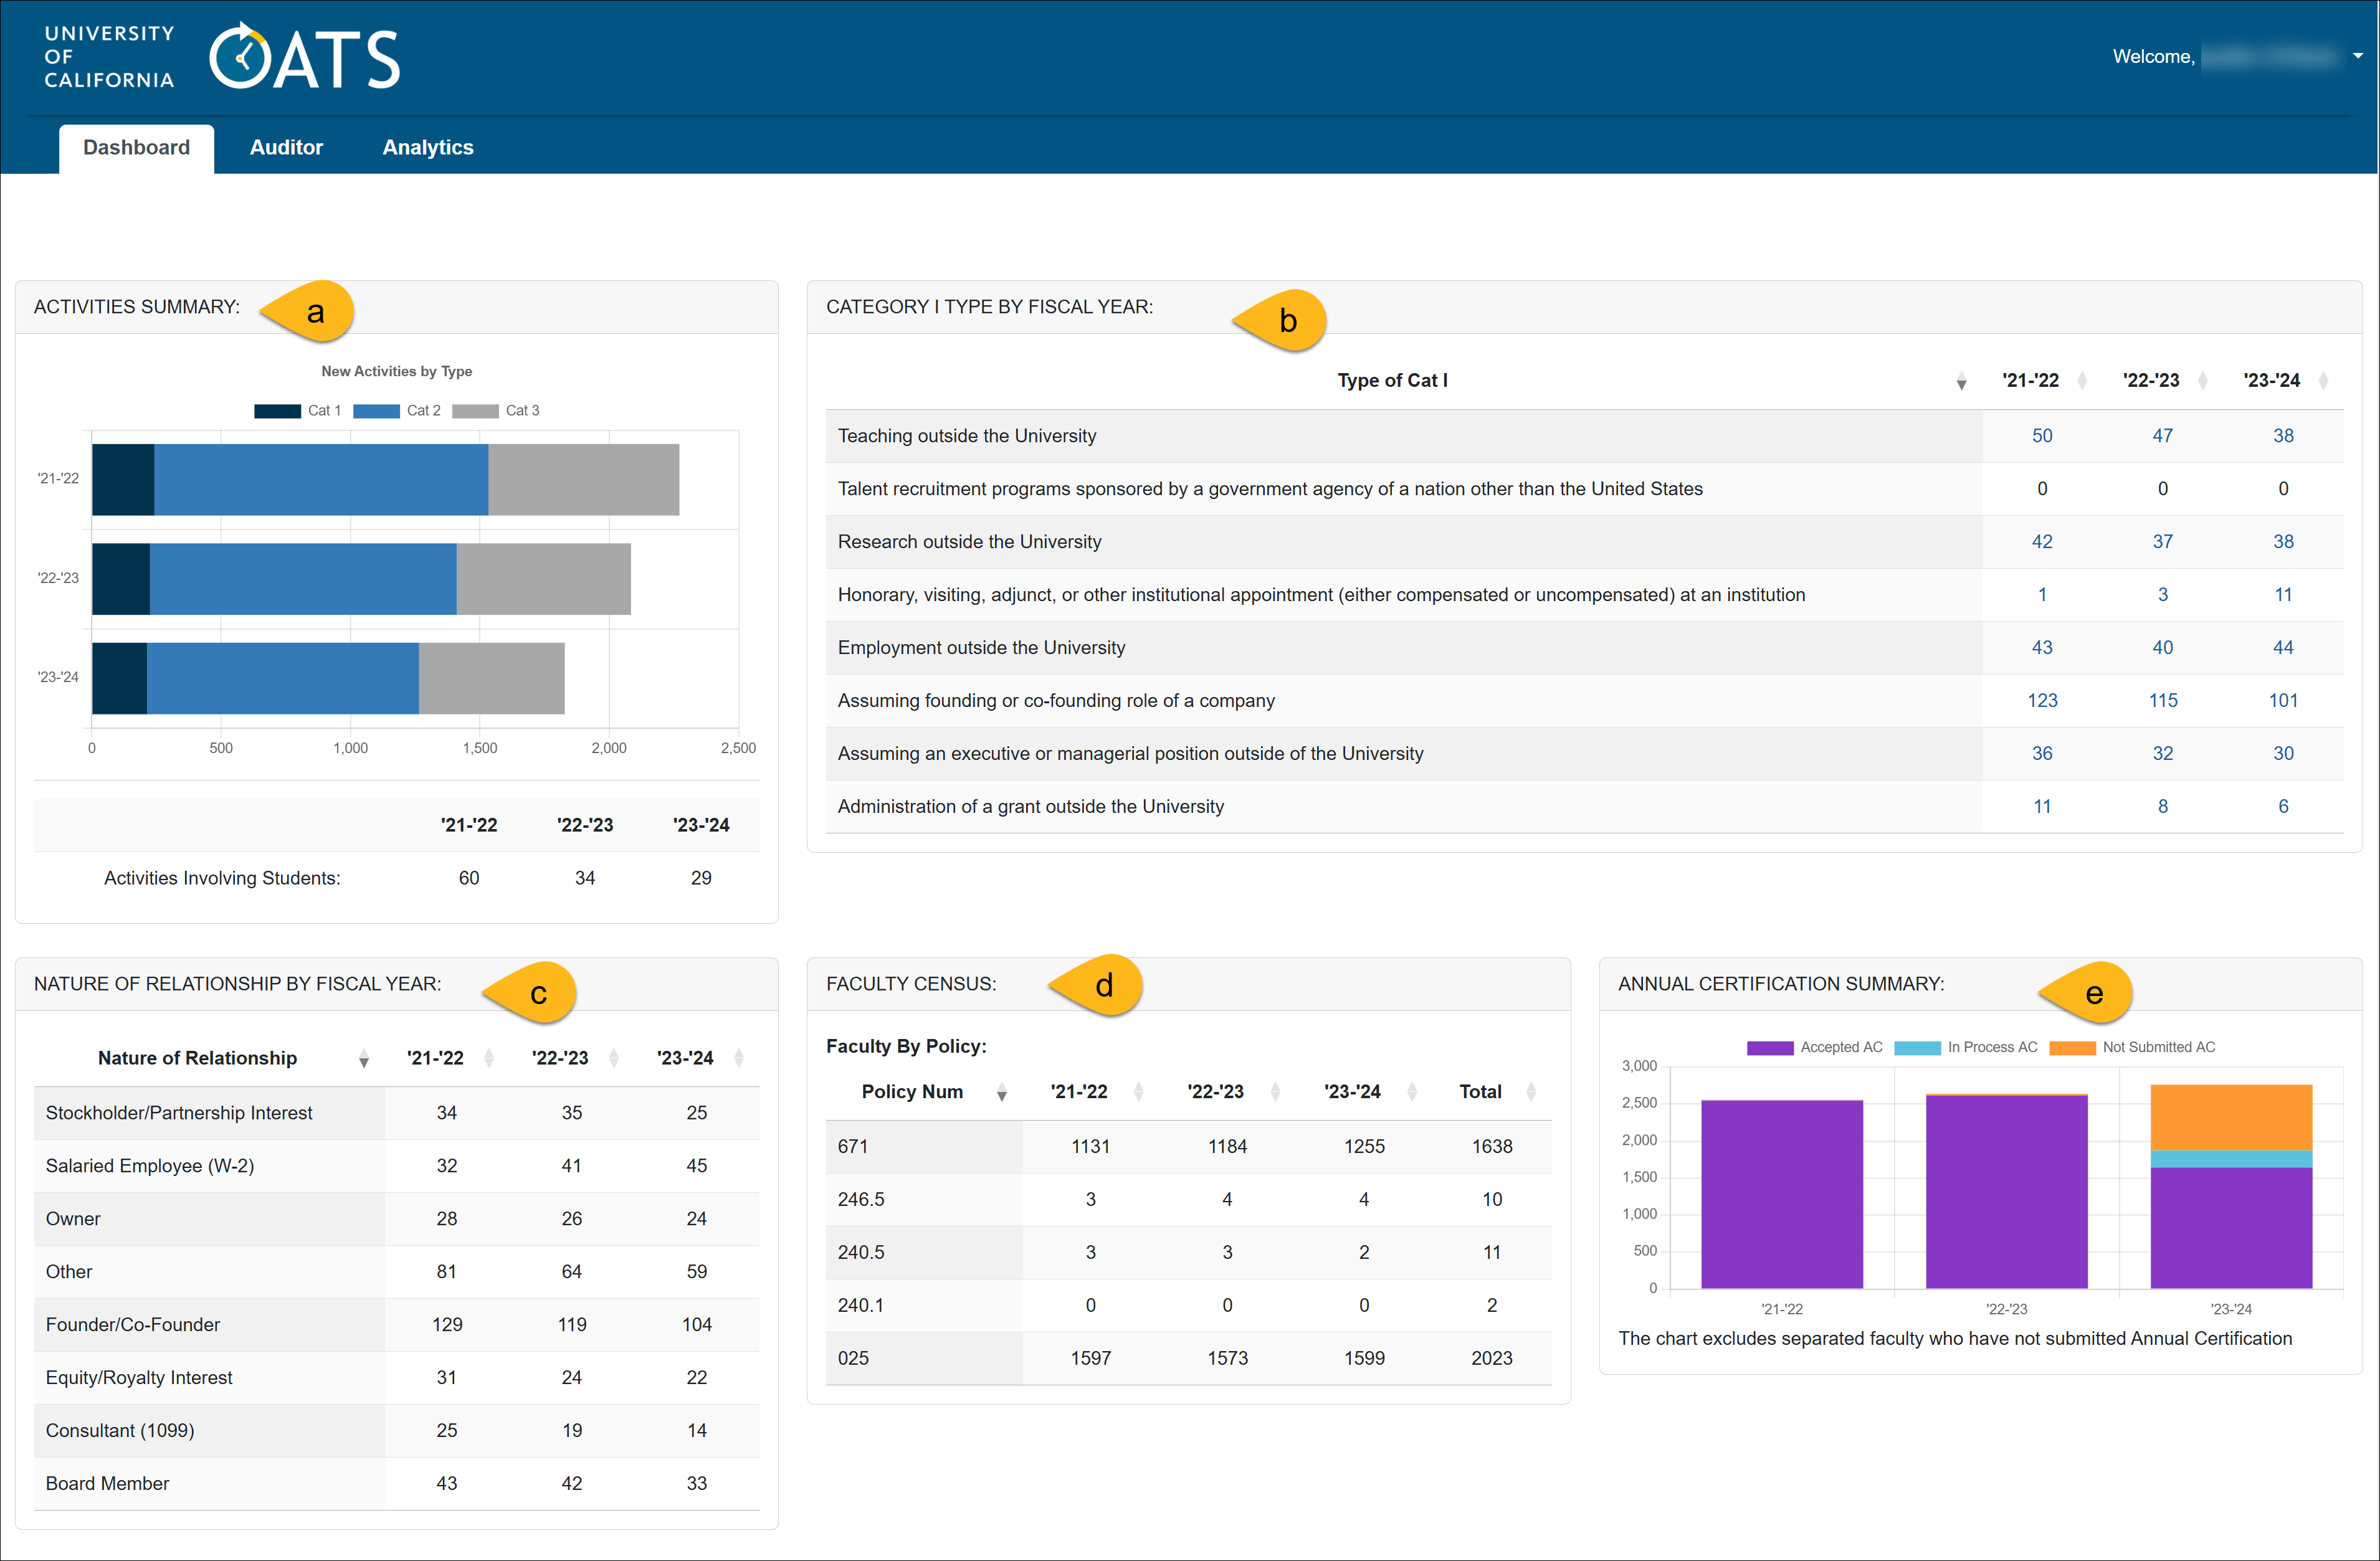
This article provides an overview of the Dashboard, which serves as your UC OATS homepage. The reports displayed on the Dashboard compile data from all the units to which you have been assigned in UC OATS.
Dashboard
The UC OATS Dashboard features a variety of reports that aggregate data from all the units assigned to you in UC OATS. To focus on a specific unit, use the "View by Unit" filter to customize the displayed data.

The Dashboard contains five reports:
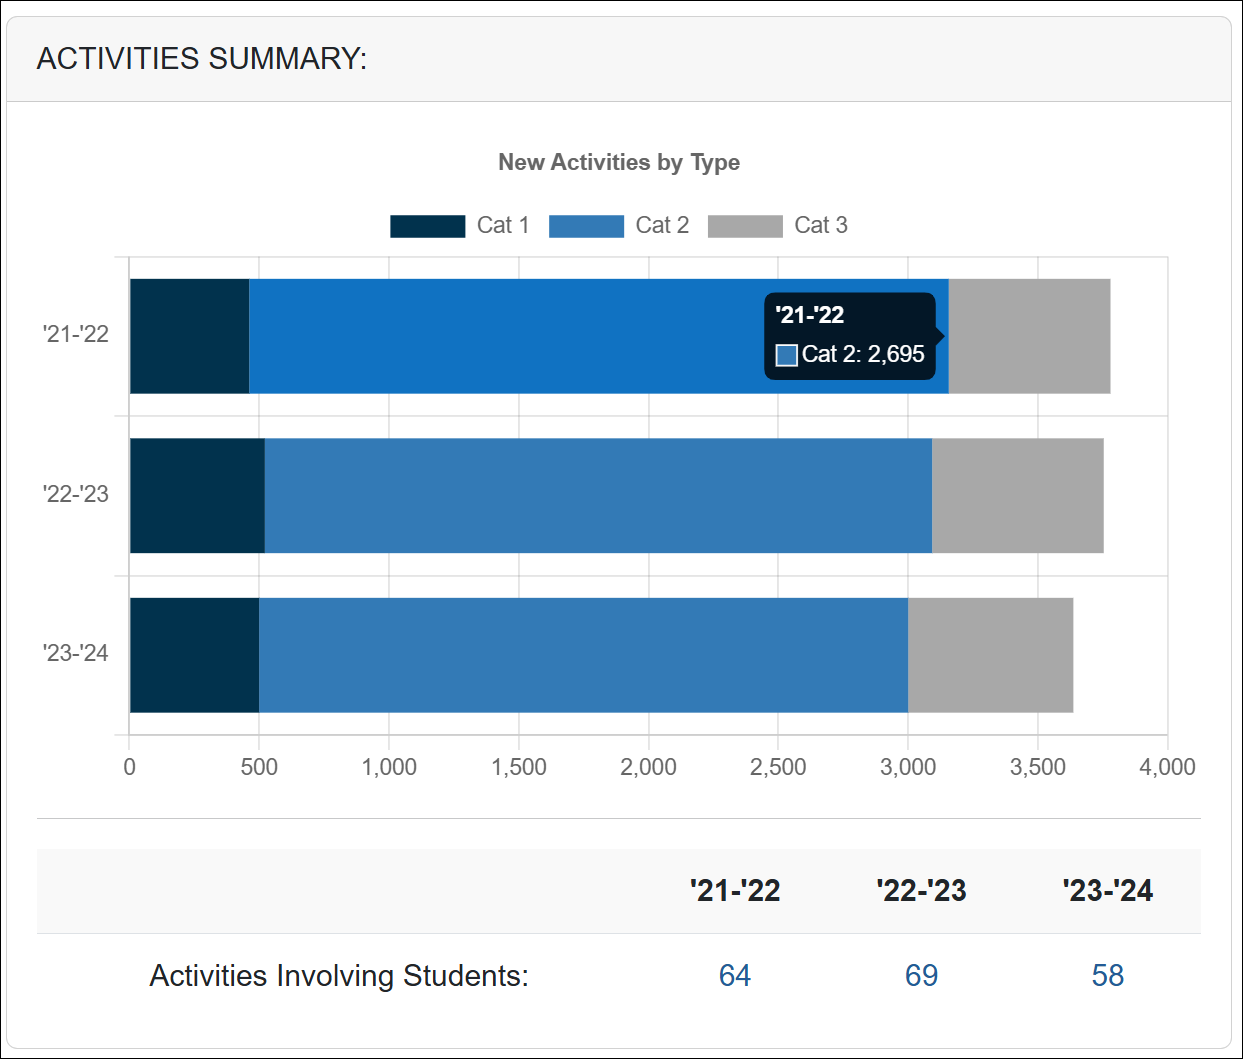
- Activities Summary: This report offers a detailed breakdown of faculty activities entered into UC OATS, organized by Category Type (I, II, III). Hover over the data points to see the exact numbers. The table includes data from all units assigned to you in UC OATS. Hover over the bars to view exact numbers and click on the chart to see the corresponding report.

- Category I Type by Fiscal Year: This report displays the number of each Category I activity entered into UC OATS across all your assigned units.
- Nature of Relationship by Fiscal Year:
This report identifies the "Nature of Relationship" types selected for Category I forms across all units assigned to you. - Faculty Census: This report displays the number of faculty members categorized by policy.
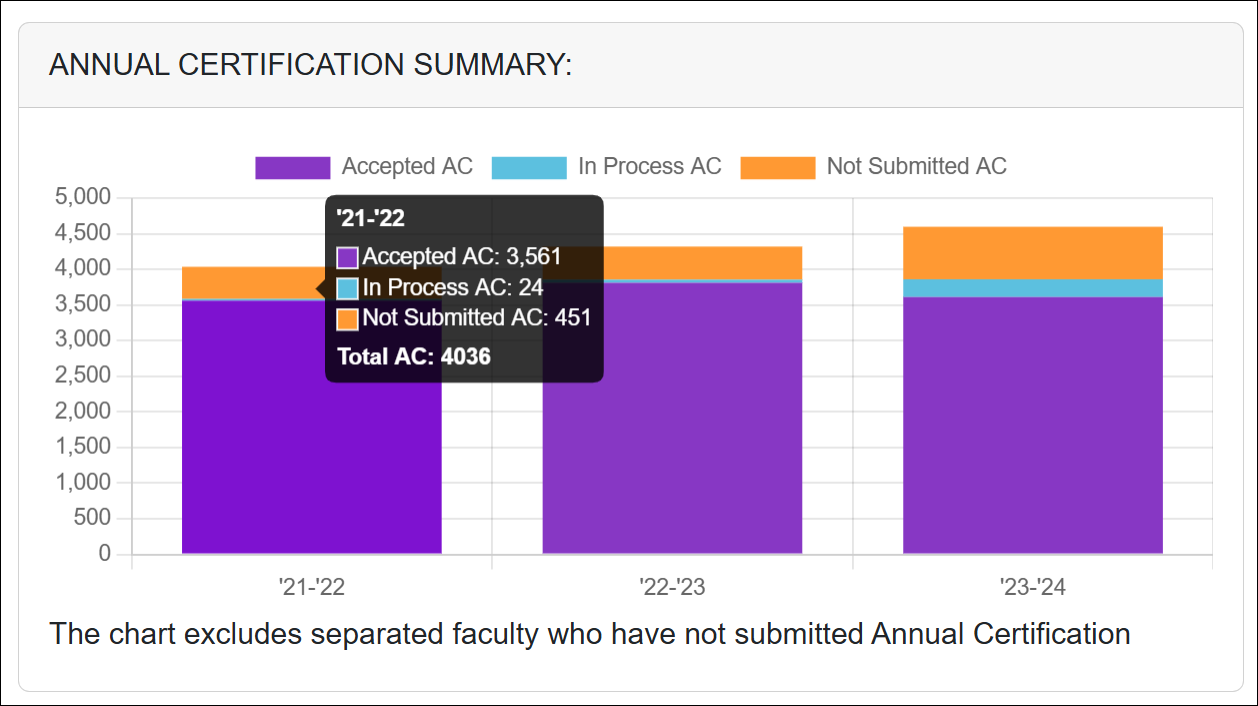
- Annual Certification: This report includes an Annual Certification summary for the faculty you have been assigned. Hover over the bars to view exact numbers and click on the chart to see the corresponding report.

Related Articles
AuditorLogging into UC OATS
Auditor Role Overview
Workspace Overview
Dashboard
All Activities
Forms in Process
Annual Certification
All Faculty & Faculty Details
Exporting Data into a Report
Adding Notes and Attachments
Outside Activity Category Types
Prior Approval Workflow
Campus Help Sites
UC Berkeley
UC Davis
UC Irvine
UC Los Angeles
UC Merced
UC Riverside
UC San Diego
UC San Francisco
UC Santa Barbara
UC Santa Cruz
UC OATS Portals
UC Berkeley
UC Davis
UC Irvine
UC Los Angeles
UC Merced
UC Riverside
UC San Diego
UC San Francisco
UC Santa Barbara
UC Santa Cruz
APM Policies
Academic Personnel & Programs
APM-025- General campus faculty
APM-671- Health sciences faculty
APM-240- Deans
APM-246- Faculty Administrators (100% time)
Last Modified: 2024-03-01 14:03:09.445272-08
