Home > Training > Health Science Reviewer (APM 671) > Workspace Overview- Dashboard
Workspace Overview: Dashboard
This article is no longer current. Please visit the updated version: View Updated Article
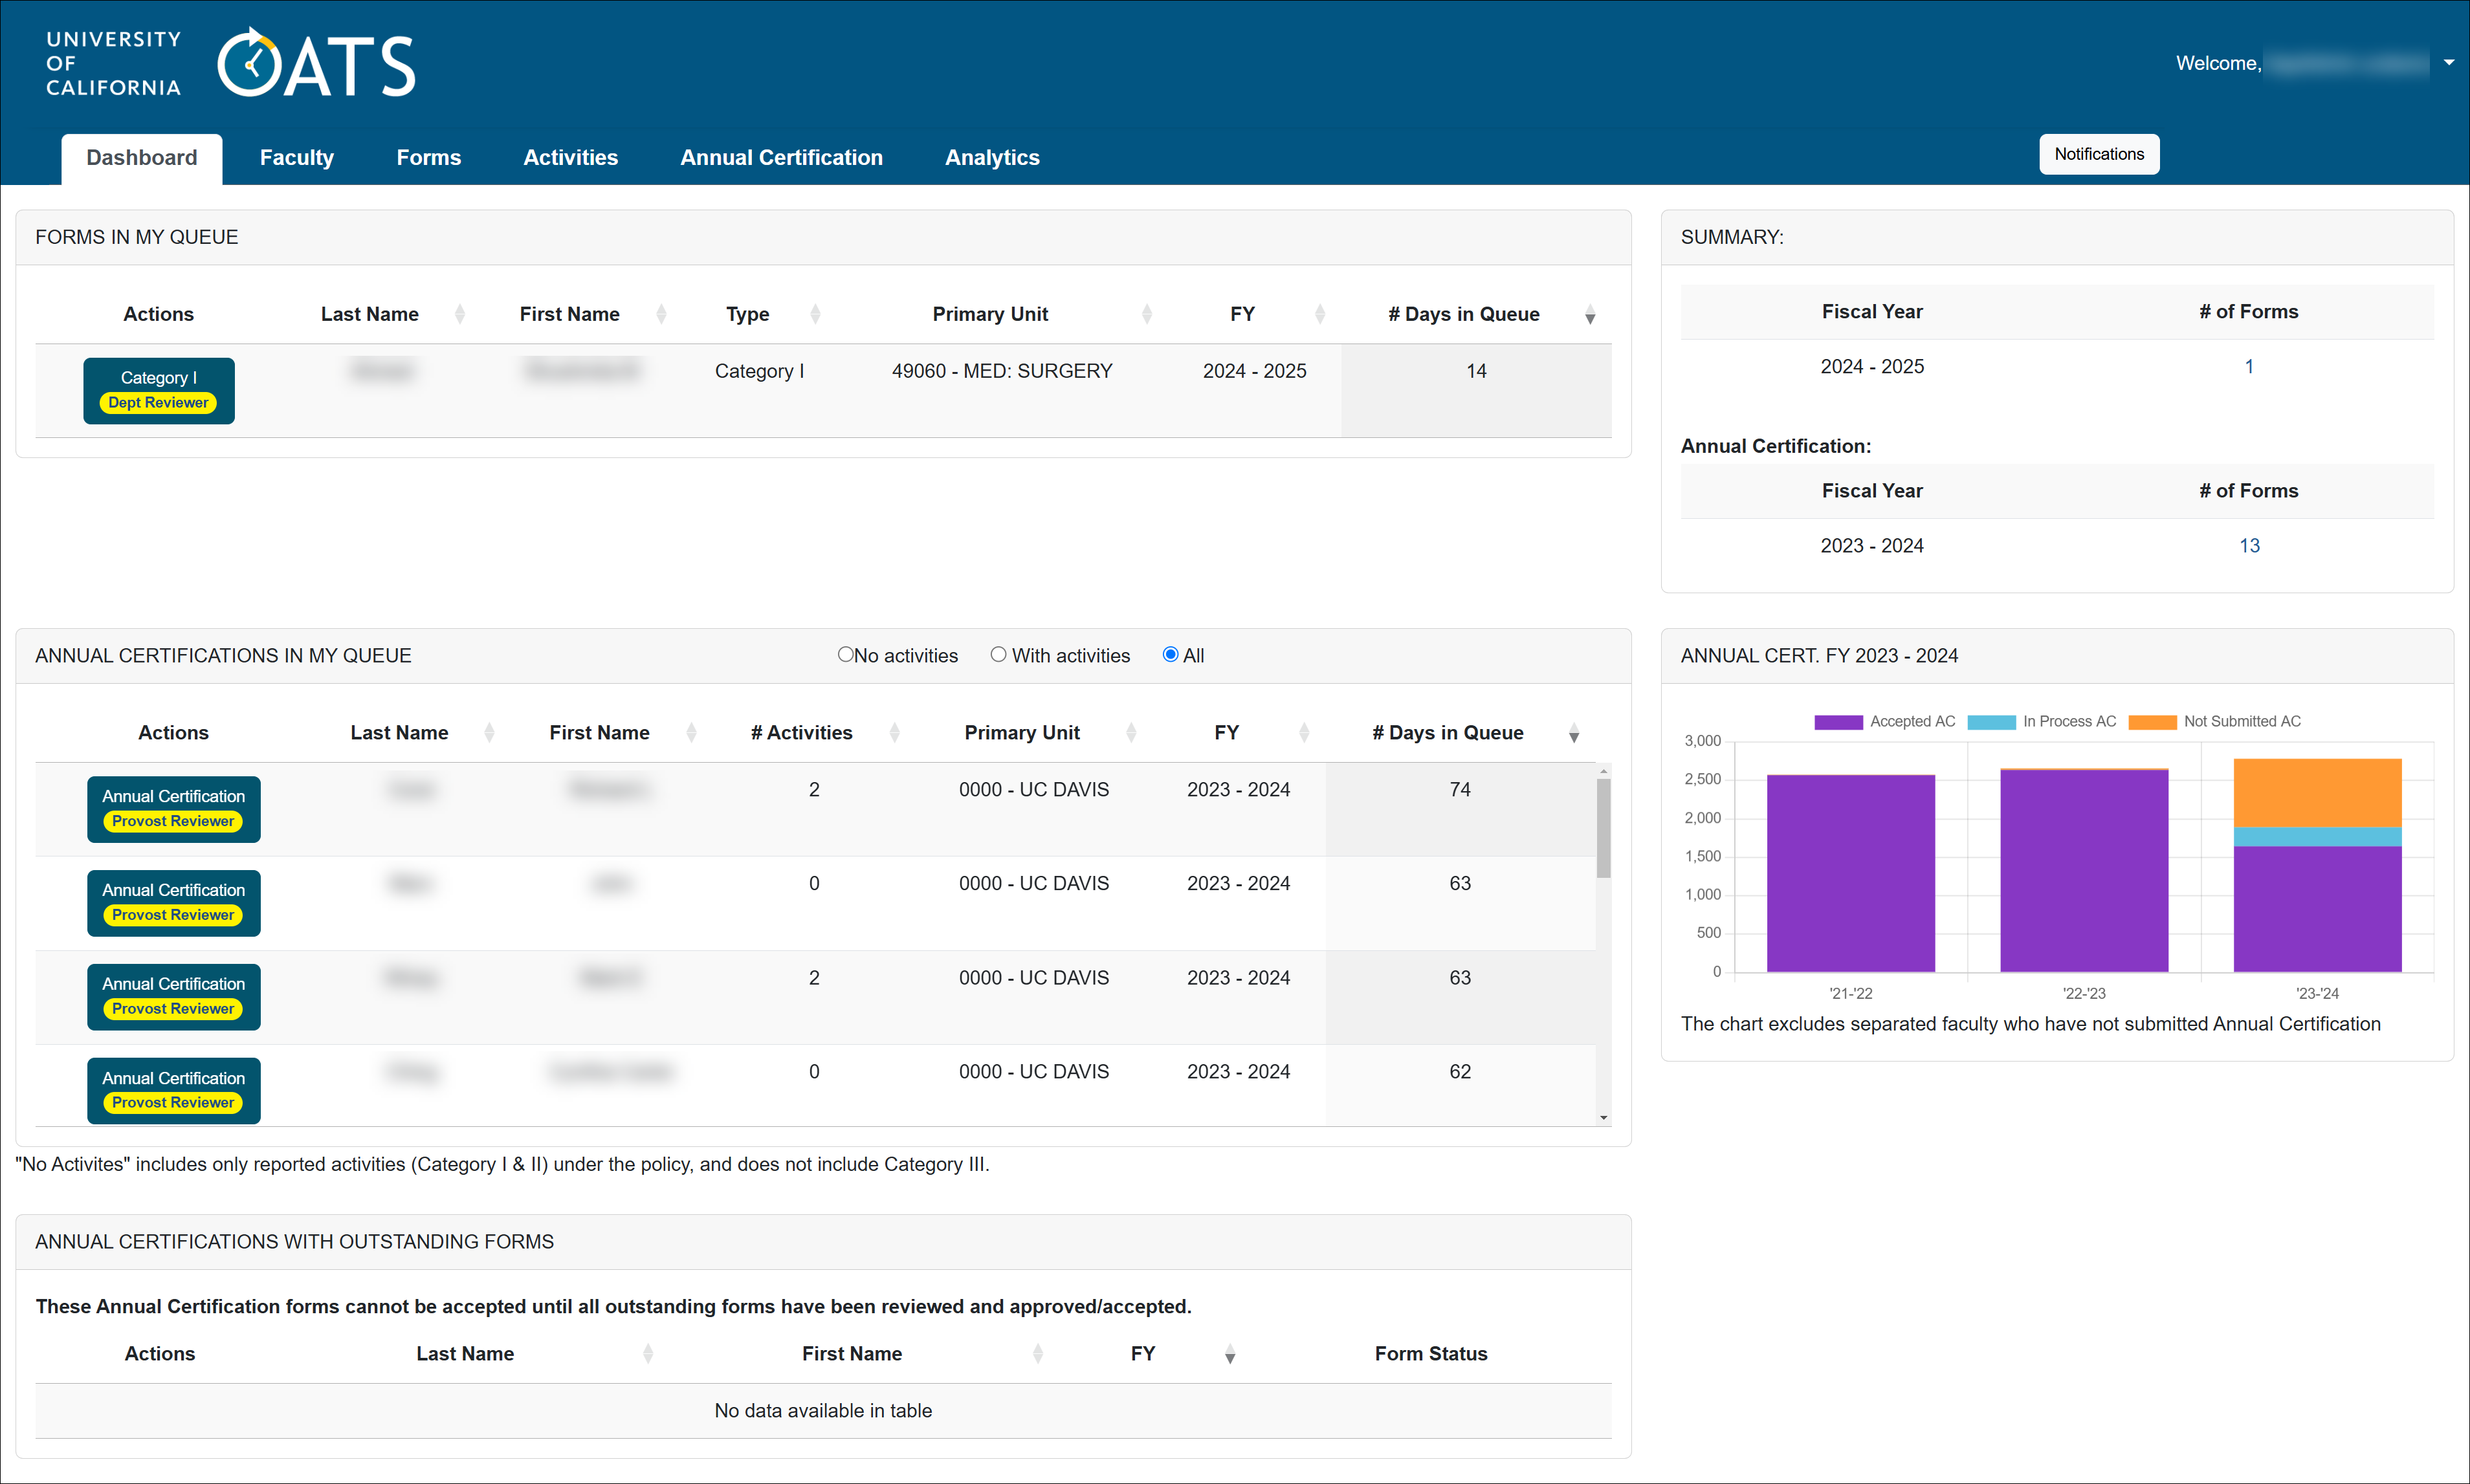
This article provides a comprehensive overview of the UC OATS Dashboard, your primary homepage upon logging in. The Dashboard serves as a centralized hub, displaying prior approval forms and annual certification reports across multiple fiscal years. These items are organized based on the number of days they have been in your queue, ensuring a clear prioritization of tasks.
Dashboard
The Dashboard has four sections: Forms in My Queue, Annual Certifications in My Queue, Summary, and Annual Certification chart report. The following will provide more information about each section.
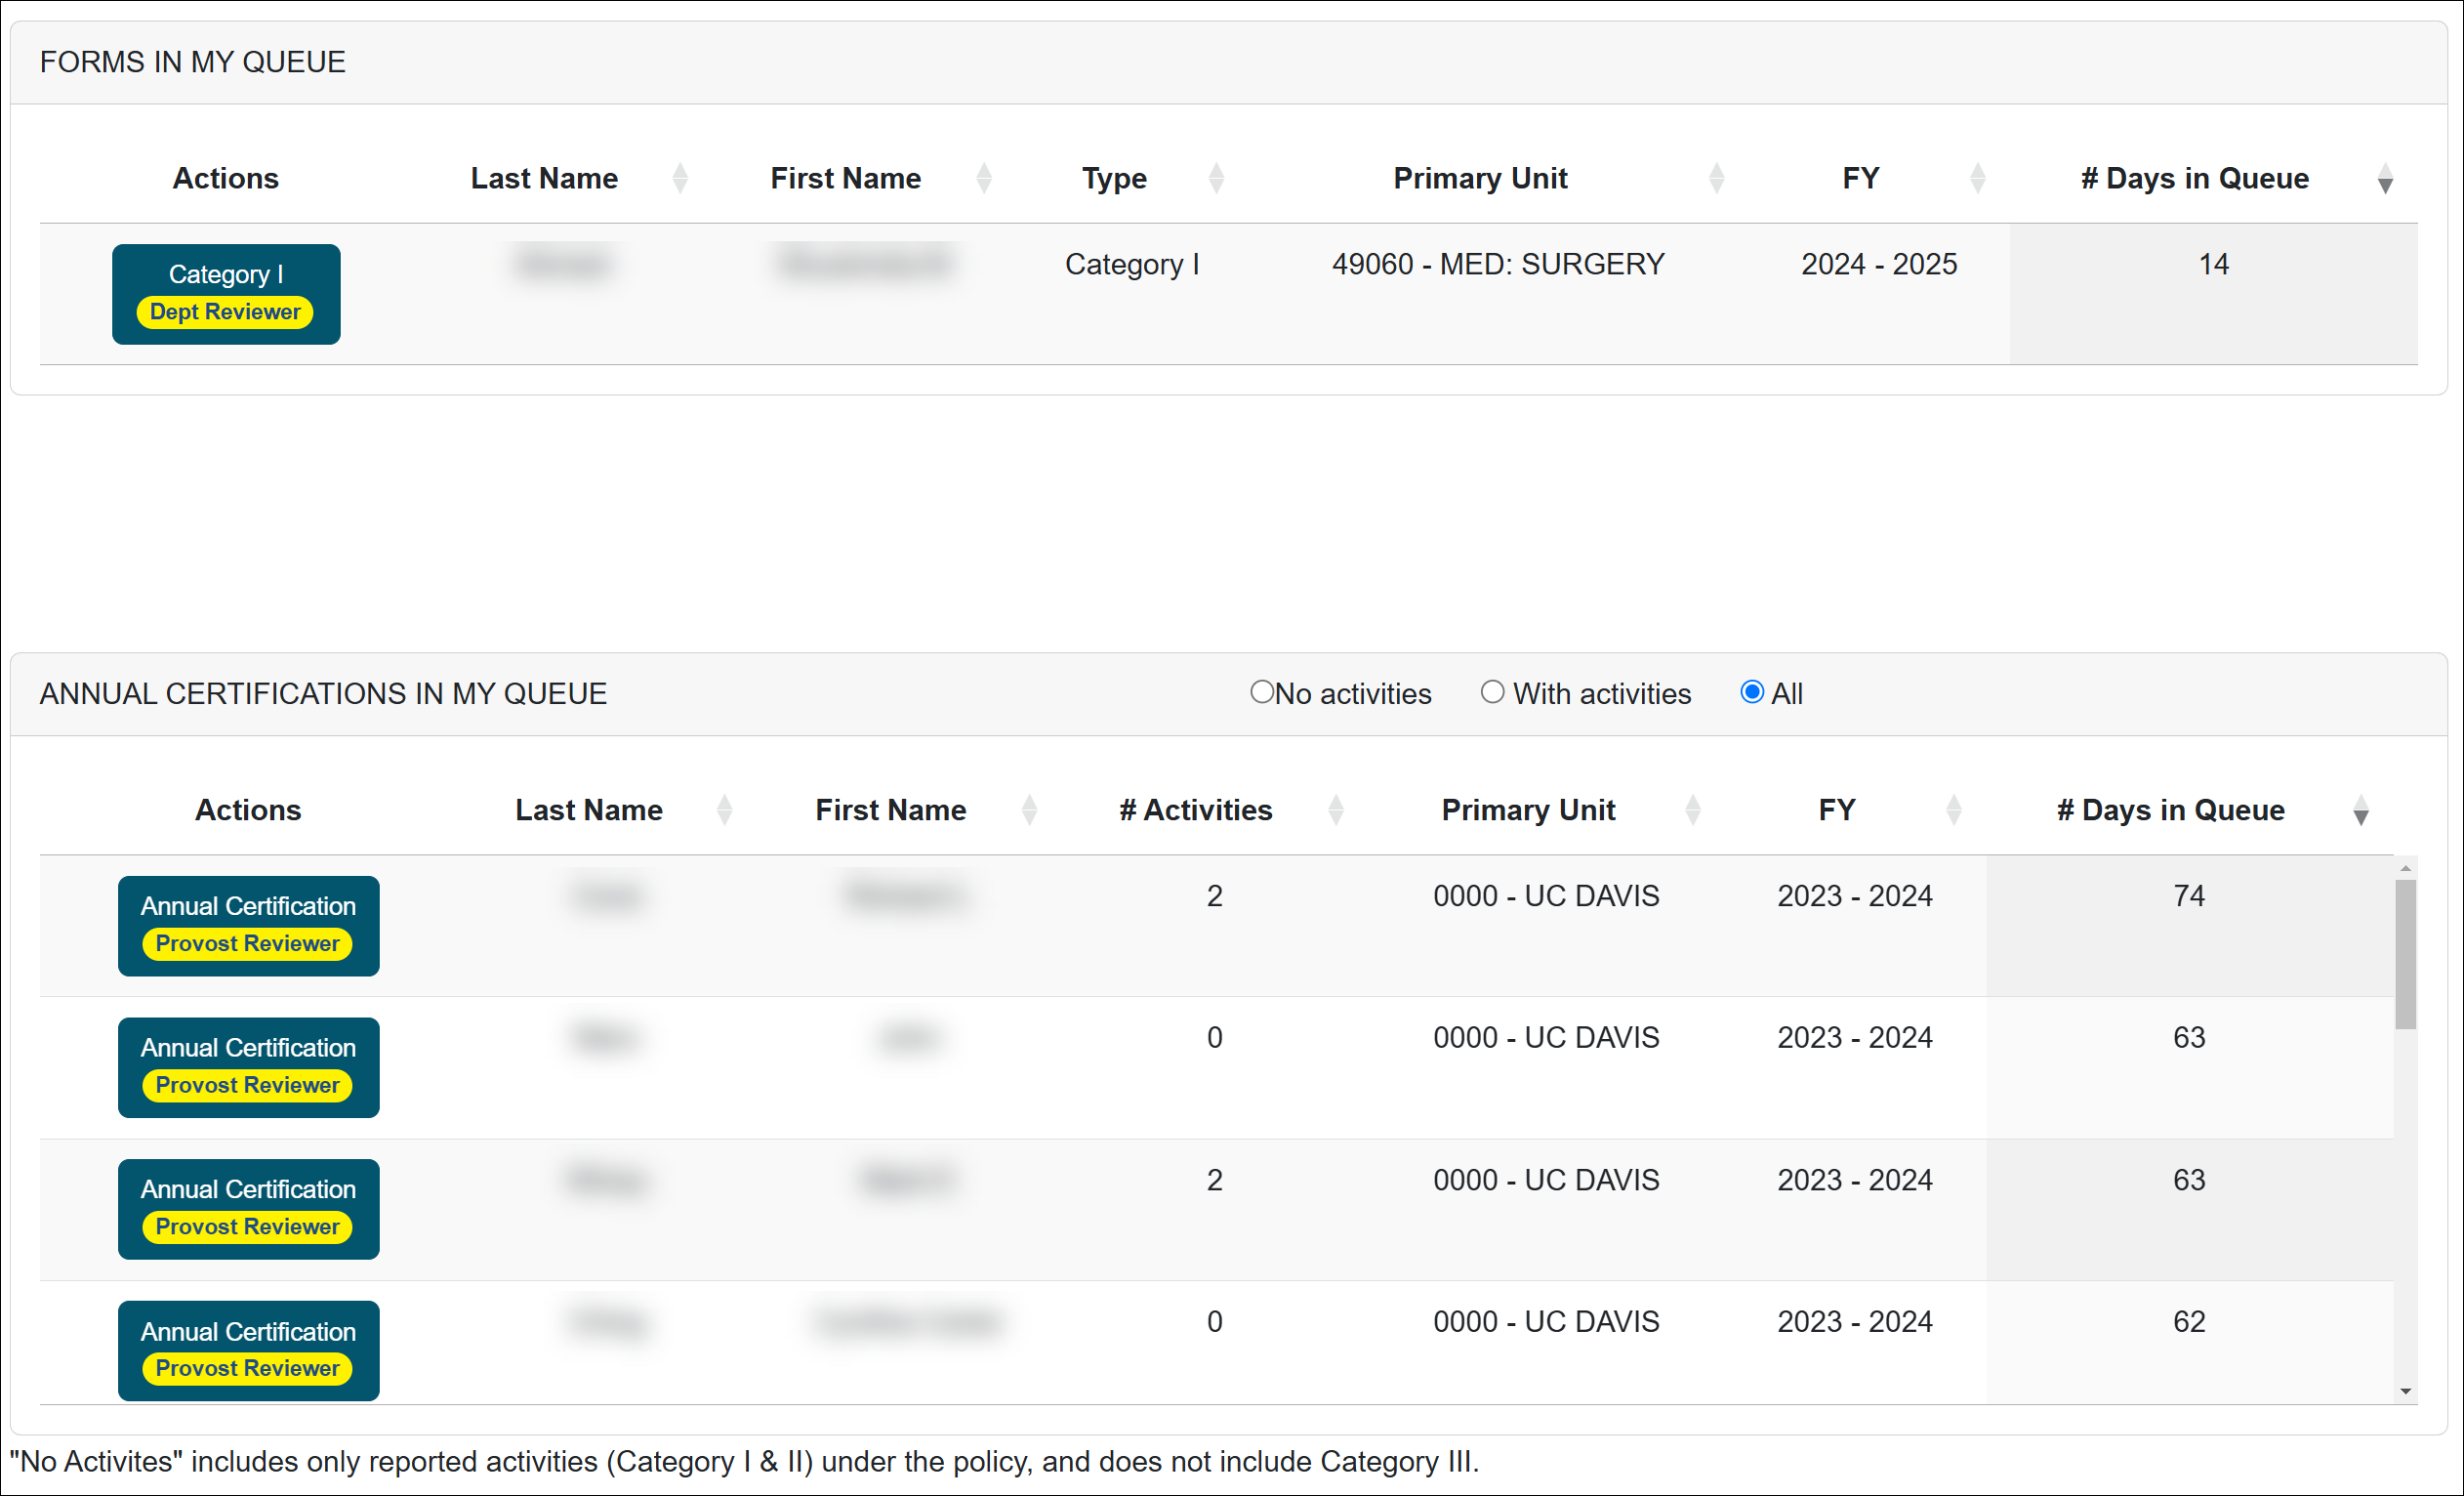
Forms in My Queue & Annual Certifications in my Queue
The forms and annual certification queues:
- The Dashboard displays prior approval forms and annual certification reports from all fiscal years, allowing you to access and review them directly. To review a form, simply click on it to open and begin your review process.
- The queues are organized by the number of days a form has been in your queue, with the oldest forms appearing at the top. This arrangement ensures that the forms requiring the most immediate attention are prioritized.
Summary
The Summary section provides an overview of the number of forms and annual certification reports awaiting your review for each fiscal year. To access a specific fiscal year's queue, simply click on the corresponding form number.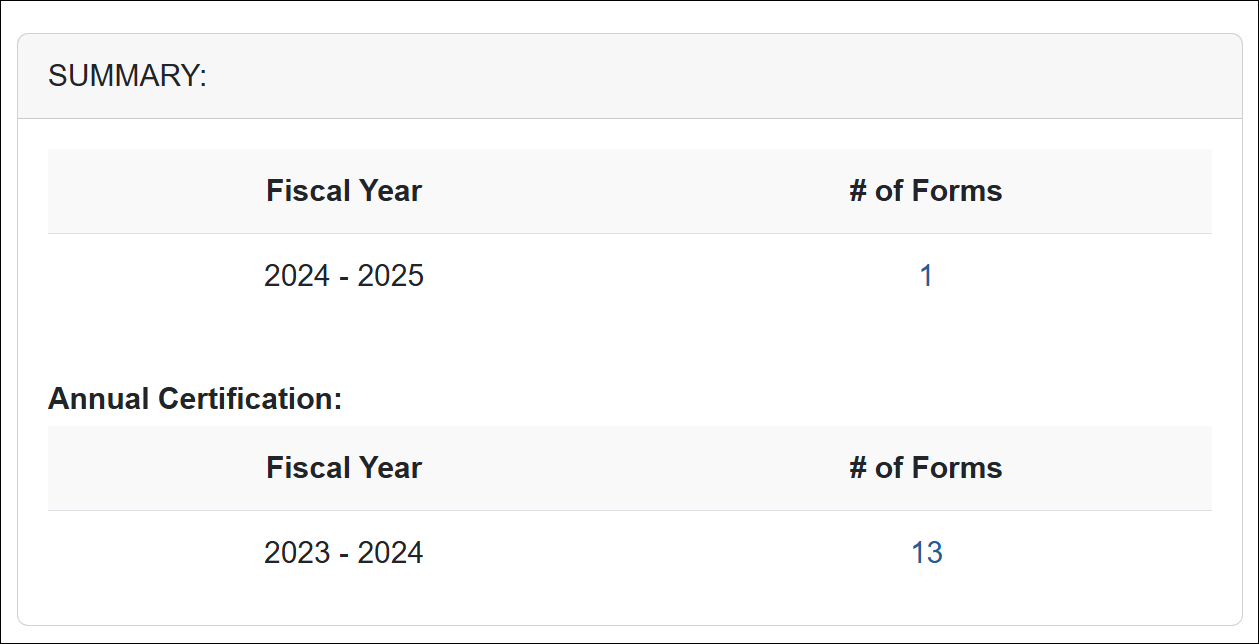
Annual Certification Summary
The Annual Certification Report provides a breakdown of the status of annual certification reports, including those that are not submitted, in process, or accepted. Hover over the bars to view exact numbers and click on the chart to go to the corresponding report. 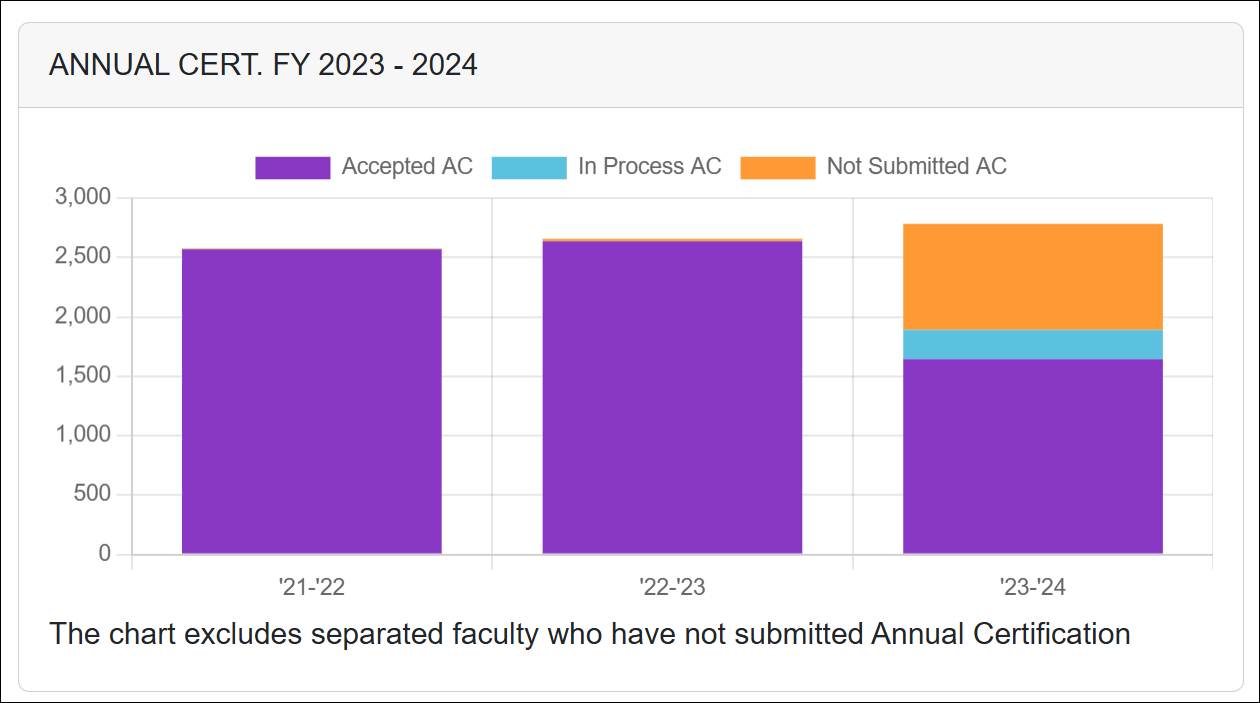
Related Articles
Health Science Reviewer (APM 671)Log into UC OATS
Reviewer Role Overview
Workspace- Dashboard
Workspace- Faculty
Workspace- Forms
Workspace- Activities
Workspace- Annual Cert.
Managing Email Notifications
Daily & Weekly Summary Emails
UC OATS Training Environment
Campus Help Sites
UC Berkeley
UC Davis
UC Irvine
UC Los Angeles
UC Merced
UC Riverside
UC San Diego
UC San Francisco
UC Santa Barbara
UC Santa Cruz
UC OATS Portals
UC Berkeley
UC Davis
UC Irvine
UC Los Angeles
UC Merced
UC Riverside
UC San Diego
UC San Francisco
UC Santa Barbara
UC Santa Cruz
APM Policies
Academic Personnel & Programs
APM-025- General campus faculty
APM-671- Health sciences faculty
APM-240- Deans
APM-246- Faculty Administrators (100% time)
Last Modified: 2022-02-03 15:51:06.704002-08