Home > Training > Unit Processing Time Report
Unit Processing Time Report
The Unit Processing Time Report provides insight into how long each organizational unit takes to process prior approval forms and Annual Certification by fiscal year. It measures processing time at each level of the review workflow, helping identify trends, bottlenecks, and opportunities for improvement as forms move through each stage of review and approval.
Note: If the Analytics tab is not visible in your workspace, you have not been assigned the Analytics role. Please contact your campus UC OATS administrator for assistance.
Reporting Options:
- Forms Reviewed/Approved (Retrospective): Displays analytics for forms that have completed the approval workflow. Note: Form analytics are reported in the fiscal year the form was originally submitted. For example, if a form was submitted in the 2024–2025 fiscal year and approved across multiple years, it will still be reported under the 2024–2025 fiscal year.
- Forms Under Review (Prospective): Displays analytics for forms that are currently in progress within the approval workflow.
Access the Report
To access the Unit Processing Time Report:
-
Select the Analytics tab.
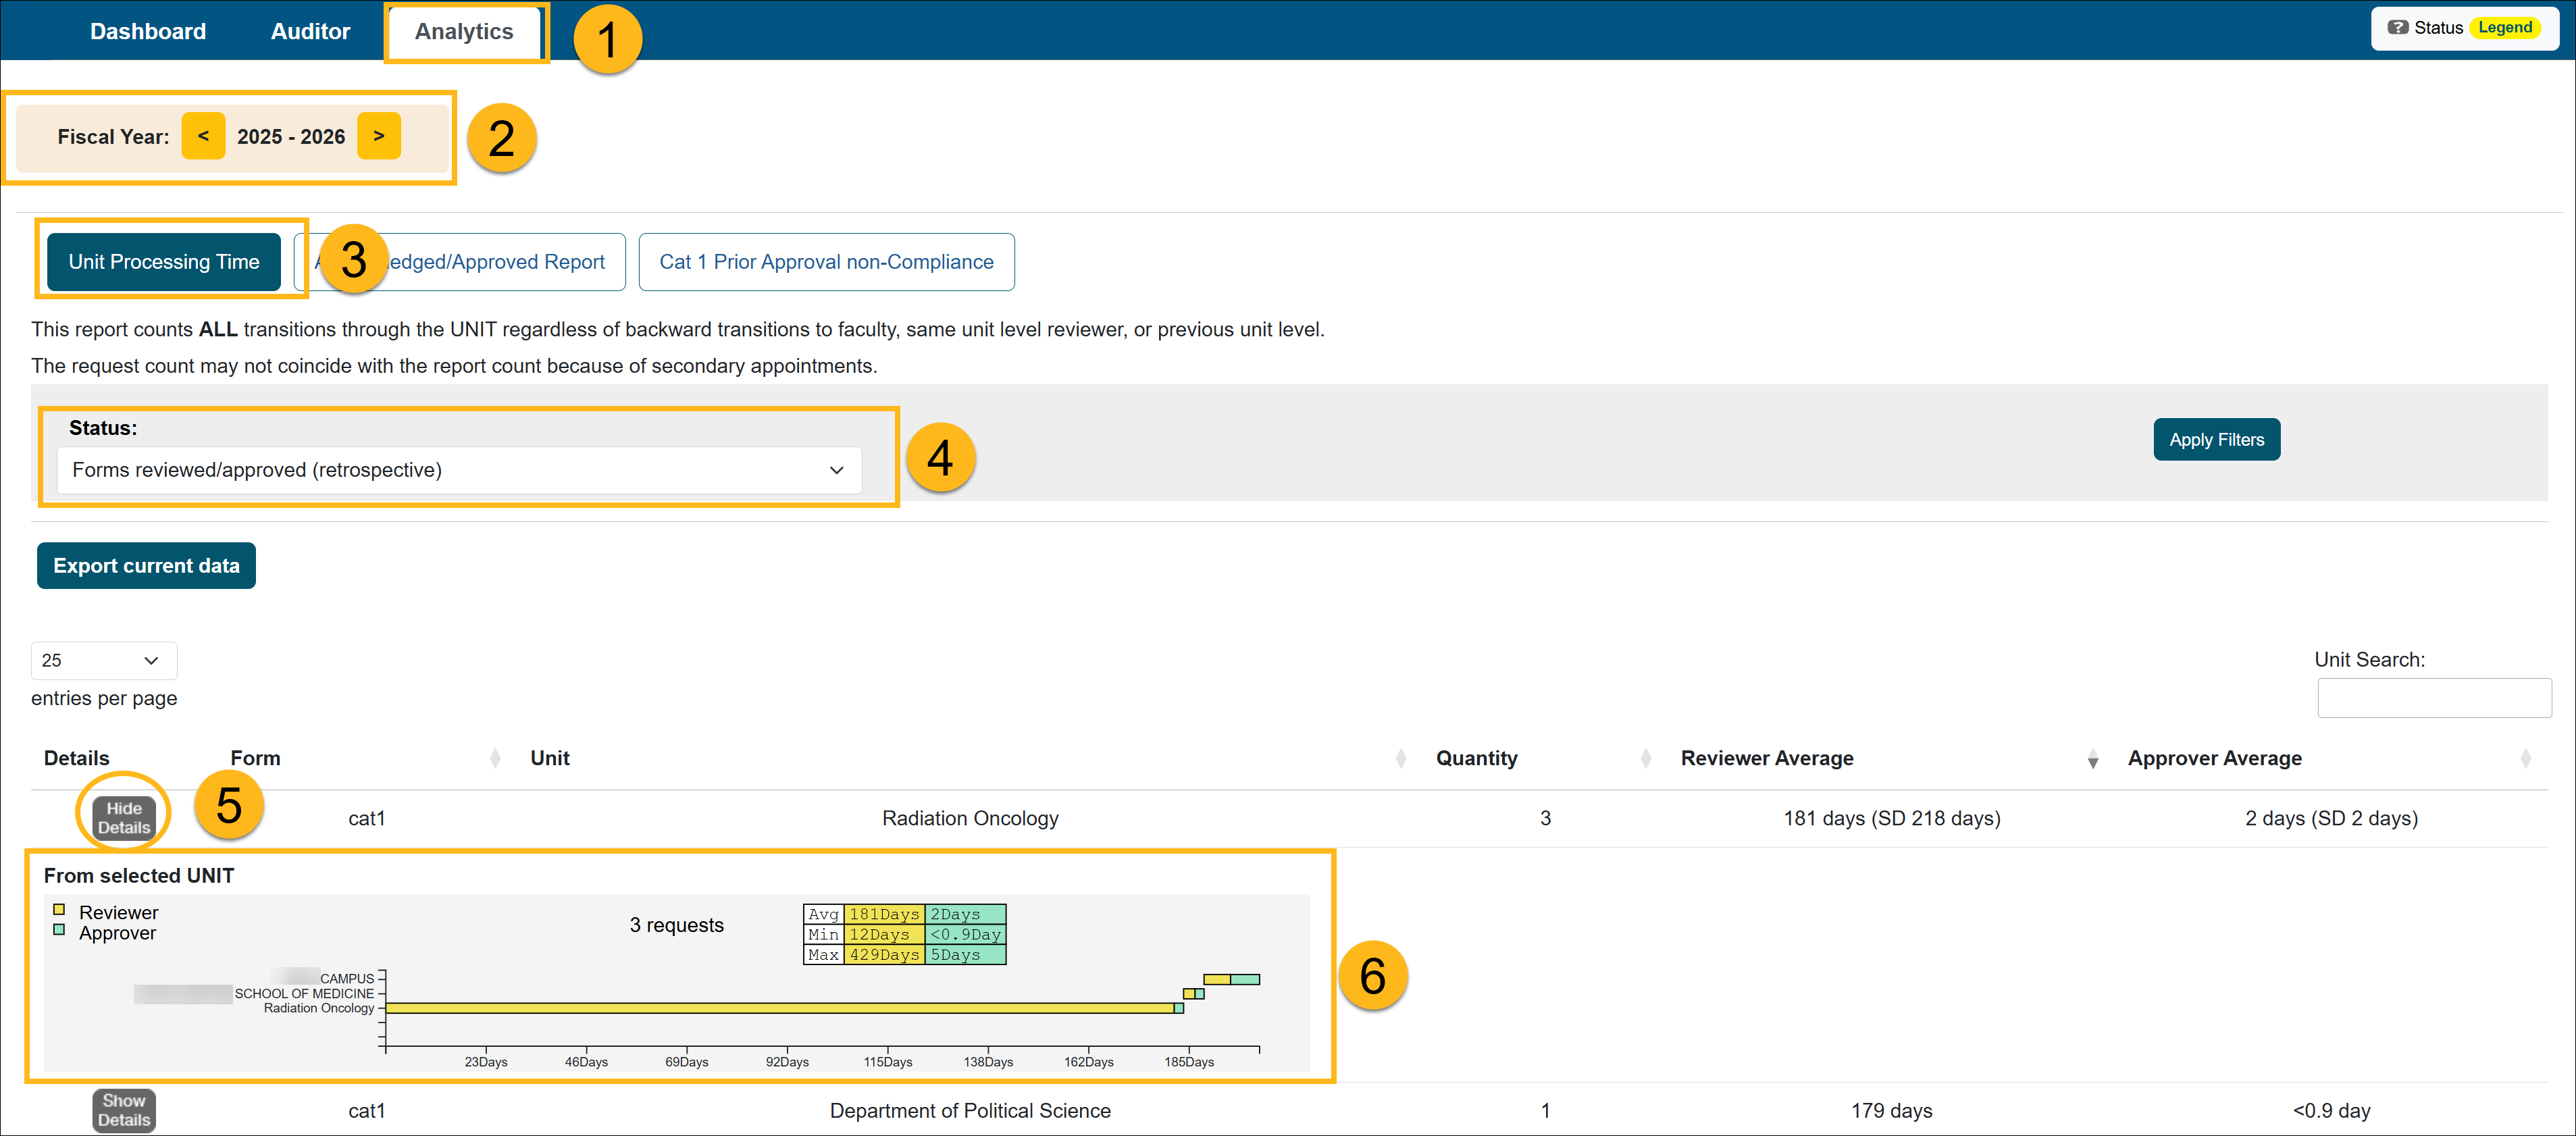
- Select the fiscal year for the report.
- Select the Unit Processing Time button.
- Use the Status filter, make your selection, and click Apply Filters.
- Locate the unit (you can sort by Unit if needed). Click Show Details to expand the results. This will display the selected unit and all lower-level units.
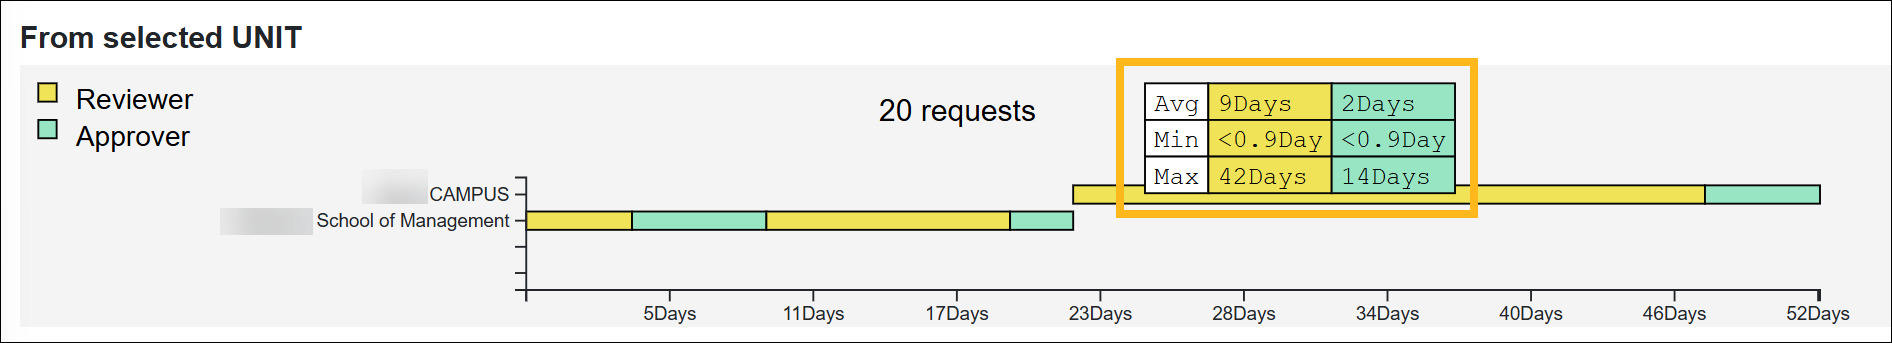
- Hover over a bar on the graph to view the analytics for that unit and all sub-units. The yellow section is the Reviewer data, and the green section is the Approver data.
Report Fields and Definitions
| Field | Description |
| Form | The type of form being analyzed in the report. |
| Unit | The organizational unit being analyzed. |
|
Quality |
The total number of forms included in the report. |
| Reviewer Average | The average time it took reviewers within the unit’s vertical to process forms. The value in parentheses represents the Standard Deviation (SD), which indicates how much processing times vary from the average. |
| Approver Average | The average time it took approvers within the unit’s vertical to process forms. The Standard Deviation is displayed in parentheses next to the average. |
| Standard Deviation | A measure of how much processing times vary from the average. A higher SD indicates greater variability, while a lower SD indicates more consistent processing times. |
Metrics Displayed
| Field | Description |
| Average Time | The average time it took forms to be processed through the unit |
| Minimum Time | The shortest processing time recorded |
|
Maximum Time |
The longest processing time recorded |
Related Articles
Analytics Role Overview
Unit Processing Time Report
Acknowledged/Approved Report
Cat I Non-Compliance Report
Potential Foreign Influence Report
Last Modified:2026-04-13 13:27:16.399391-07