Home > Training > General Campus Approver (APM 025) > Unit Processing Time Report
Unit Processing Time Reports
This article will show you how to use the Unit Processing Time reports. This report will show how long each unit on your campus takes to process each type of prior approval form and annual certification.
- Only users with the Analytics User role in UC OATS will see the Analytics button.
To access the report:
-
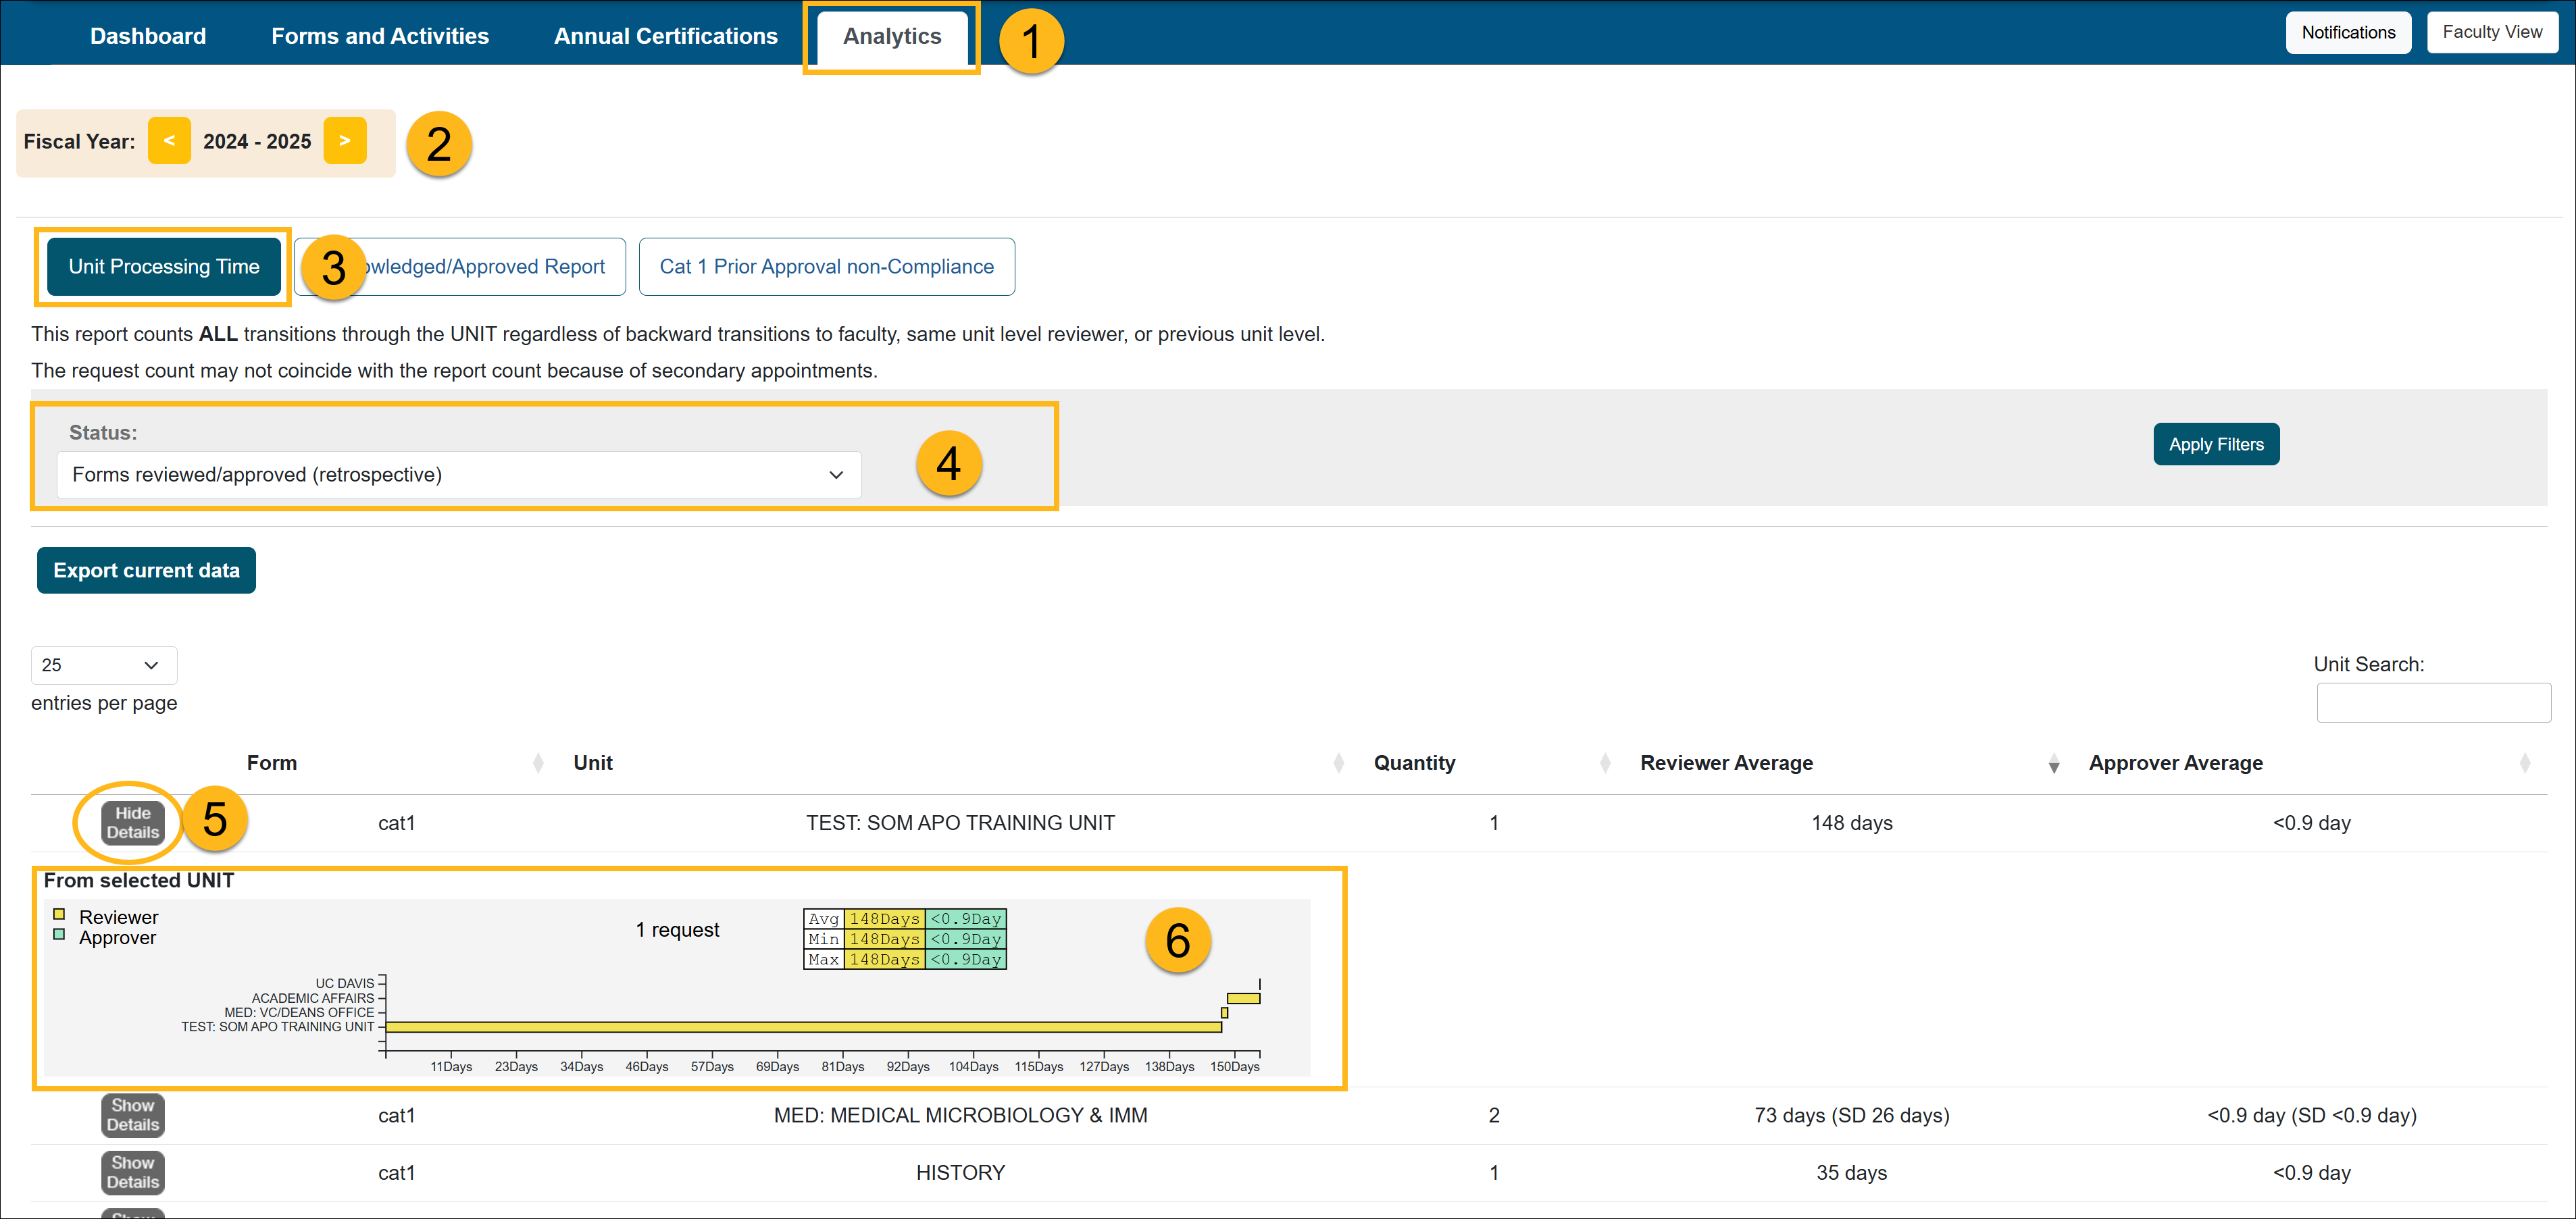
Select the Analytics button.

- Select the fiscal year for the report
- Select the Unit Processing Time.
- Go to the filter and make your selections:
- Forms reviewed/approved (retrospective) - shows analytics for forms that have finished processing through the approval workflow. Note: The form analytics will be displayed in the fiscal year the form was submitted. For example, if a form was submitted in the 2022-2023 fiscal year and was approved for multiple years the form analytics would be in the 2022-2023 fiscal year.
- Forms under review (prospective) - shows analytics for forms that are currently being processed through the approval workflow
- Locate the unit and form you would like to view and then click the Show Details button. The unit you selected and all lower-level units will be displayed.
- Form: The prior approval form that is being analyzed in the report
- Unit: The unit that is being analyzed
- Quantity: The total number of forms in the report
- Reviewer Average: The average time it took reviewers within that unit's vertical to process the forms. In parenthesis, the standard deviation (SD) shows the variation from the average.
- Standard Deviation: Standard deviation is a way to measure how spread out or varied a set of numbers is. It helps you understand how much individual values in a group differ from the average (or mean) value. In simple terms, standard deviation helps you get a sense of how "typical" or "unusual" a data set is. It's like a measure of how much the data points like to "deviate" from the average.
- Approver Average: The average time it took approvers within that unit's verticle to process the forms. The Standard Deviation is beside the number of days in parenthesis.
- Hover over a bar on the graph to view the analytics for that unit and all sub-units. The yellow section is the Reviewer data and the green section is the Approver data.
- Average Time - the average time it took the forms to process through the unit
- Minimum Time - the least amount of time a form took to process through the unit
- Maximum Time - the most amount of time a form took to process through the unit
Related Articles
Gen. Campus Approver (APM 025)Analytics Role Overview
Unit Process Time Reports
Acknowledged/Approved Report
Cat I Prior Appr. Non-Comp Report
Campus Help Sites
UC Berkeley
UC Davis
UC Irvine
UC Los Angeles
UC Merced
UC Riverside
UC San Diego
UC San Francisco
UC Santa Barbara
UC Santa Cruz
UC OATS Portals
UC Berkeley
UC Davis
UC Irvine
UC Los Angeles
UC Merced
UC Riverside
UC San Diego
UC San Francisco
UC Santa Barbara
UC Santa Cruz
APM Policies
Academic Personnel & Programs
APM-025- General campus faculty
APM-671- Health sciences faculty
APM-240- Deans
APM-246- Faculty Administrators (100% time)
Last Modified: 2024-01-30 12:52:19.973786-08
